
 Stock: Descending Triangle Nears Breaking Point as Volatility Looms")
Key Takeaways
- SOL is currently priced at $84.63, confined within a compressed CRT band spanning $84.43 to $85.05.
- Technical analyst Ali Charts identified a descending triangle formation reaching its apex, suggesting a 10% price movement either upward to $93 or downward to $76.
- The resistance zone between $86 and $88 continues to reject price advances, with SOL unable to break through on numerous attempts.
- The Solana Foundation has announced that Falcon quantum-resistant cryptography is fully developed and can be activated without compromising network efficiency.
- Limited ETF interest combined with falling social engagement metrics suggest continued sideways trading ahead.
Solana finds itself at a critical juncture. After days of price compression, technical indicators suggest an imminent significant price swing — though the ultimate direction remains unclear.
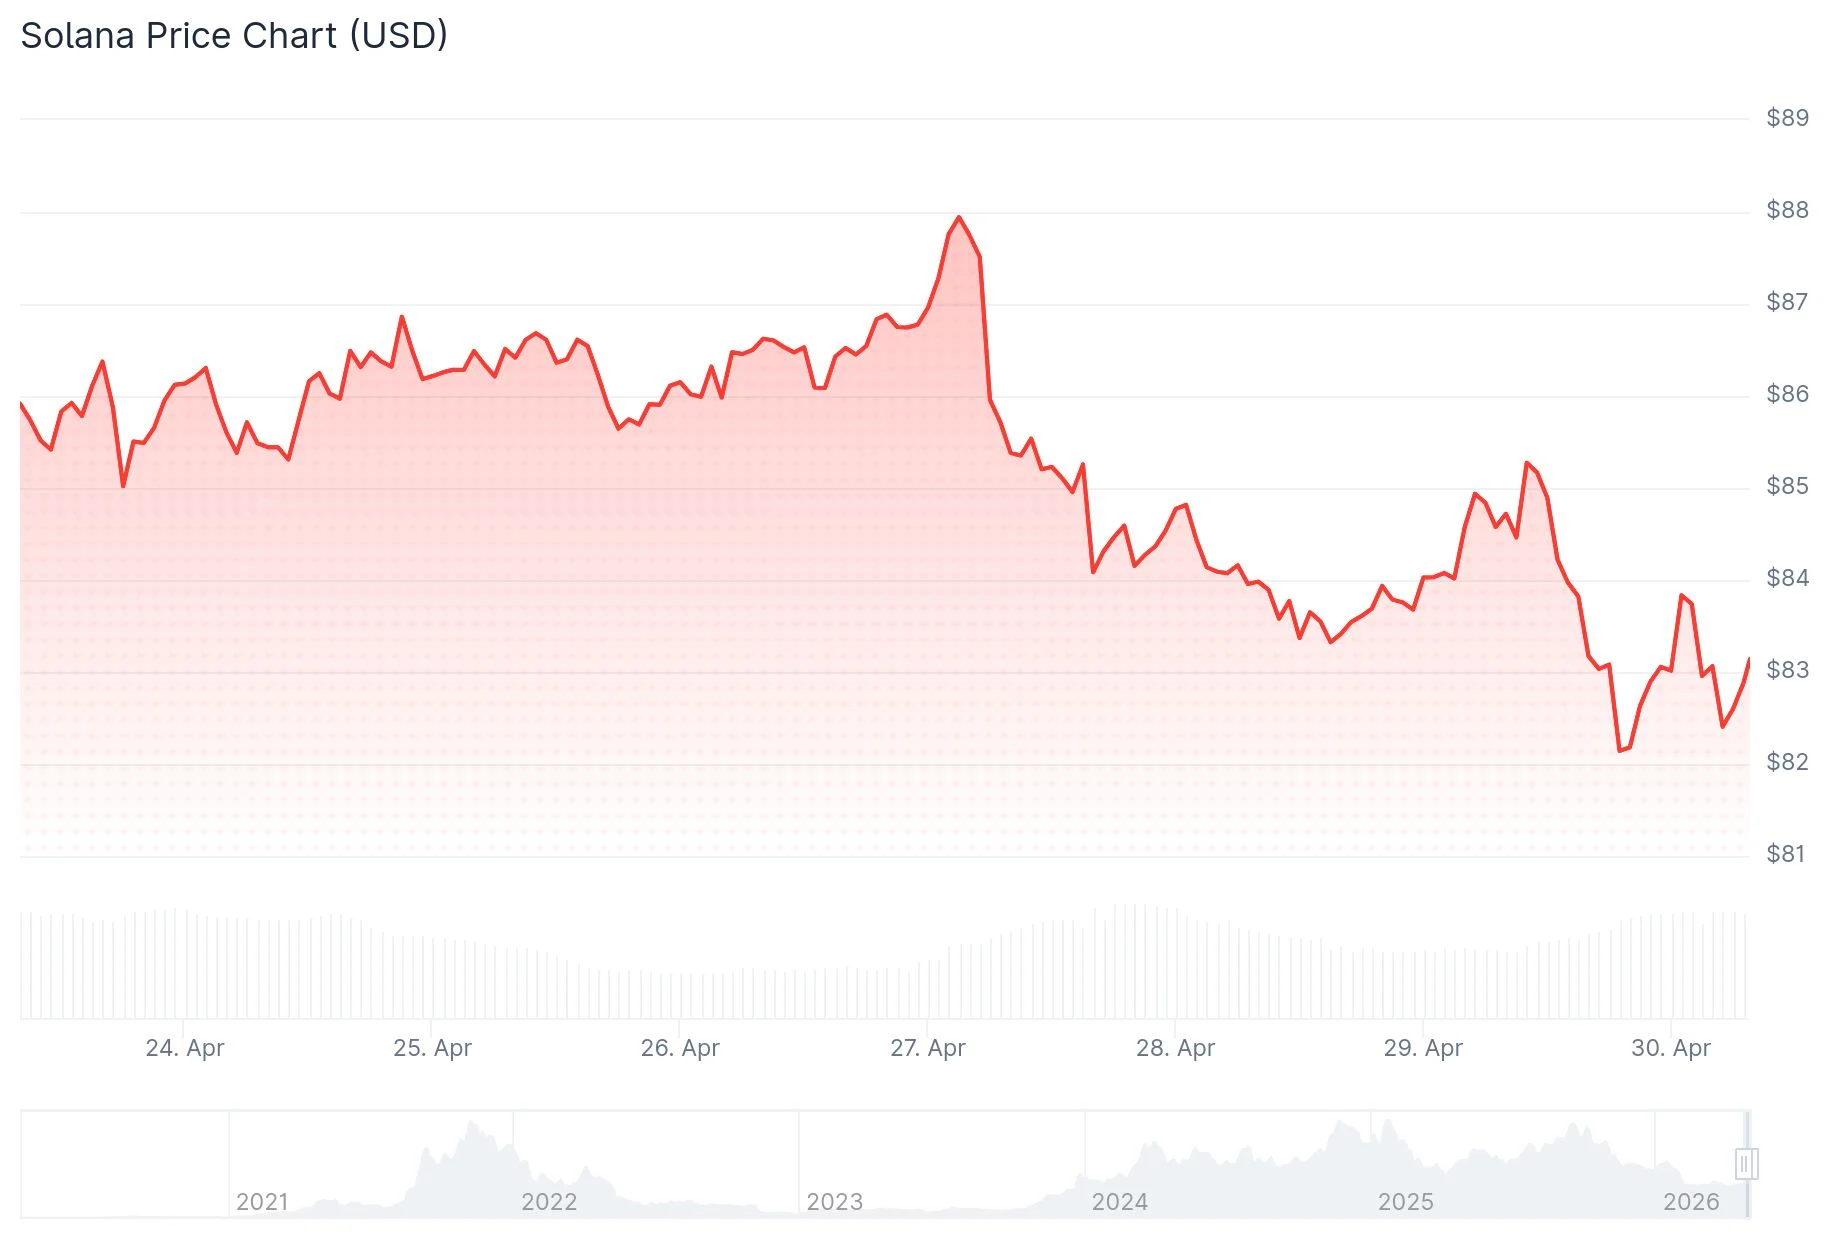
As of April 29, SOL is changing hands at $84.63. The cryptocurrency remains locked within a tight trading corridor, with the upper boundary of the current candle at $85.05 and the lower limit at $84.43. The Stop and Reverse (SAR) indicator establishes a floor at $84.27, while the 20-day exponential moving average hovers just beneath at $84.24, creating a compact support zone.
Remarkably, four key moving averages—the 50-day, 100-day, and 200-day EMAs—are clustered within a mere 1.2-point span directly above the current trading level. Such extreme compression historically precedes rapid directional movement.
Technical Pattern Analysis
Crypto analyst Ali Charts highlighted earlier this week that SOL has formed a descending triangle on shorter timeframes, now positioned precisely at the pattern’s apex. The descending resistance trendline has been declining from the $92 level, while rising support has been building from the April 18 bottom near $82. Price action has been systematically narrowing between these converging lines.

When triangles reach their apex, they typically exhaust available trading room and resolve with decisive directional moves. According to Ali Charts’ projection, the pattern suggests approximately 10% volatility, potentially driving price toward $93 on an upside breakout or down to $76 in a breakdown scenario. The current CRT configuration favors bullish resolution, with SAR and EMA clustering providing immediate downside protection.
The $86–$88 price range continues functioning as formidable overhead resistance. SOL has repeatedly attempted to reclaim this zone without success, while both Relative Strength Index and MACD momentum indicators display weakening signals. A decisive daily close above $85.05 would represent the initial breakthrough needed to challenge that resistance band once more.
A deeper concern involves the broader channel support. Should the $80 psychological level fail, technical analysts anticipate accelerated selling pressure toward the mid-$70s territory. Currently, the highest probability scenario involves continued range-bound consolidation between $81 and $87 as the pattern approaches its resolution point.
Quantum-Resistant Infrastructure Complete
Beyond price dynamics, the Solana Foundation released a comprehensive quantum preparedness assessment this week. Both primary development teams supporting Solana’s core protocol—Anza and Firedancer—have successfully integrated test implementations of Falcon, the NIST-approved post-quantum cryptographic signature algorithm that Algorand currently operates in live production.
Falcon deployment can be triggered in response to emerging quantum computing threats without requiring disruptive network upgrades or downtime. The integration maintains Solana’s characteristic high-speed transaction processing and throughput capabilities.
This announcement follows two significant April security developments. The Drift protocol experienced a $280 million security breach attributed to a sophisticated six-month infiltration campaign linked to North Korean threat actors. Additionally, the Solana Foundation introduced STRIDE, a comprehensive security assessment initiative providing continuous threat detection for decentralized finance protocols managing over $10 million in total value locked.
Regarding derivatives markets, futures trading volume declined 16.39% to $7.45 billion while open interest remained essentially unchanged at $5.02 billion. The aggregate long-to-short positioning ratio stands at 1.0076, with major exchange top traders on both Binance and OKX maintaining long bias exceeding 2.64.
Throughout the past day, long position holders experienced $3.70 million in forced liquidations compared to $1.38 million for short positions. Current open interest of $5.09 billion remains substantially below the late 2025 peak of approximately $16 billion.