
 Stock: Will $80 Support Hold or Is a Decline to $60 Imminent?")
Key Takeaways
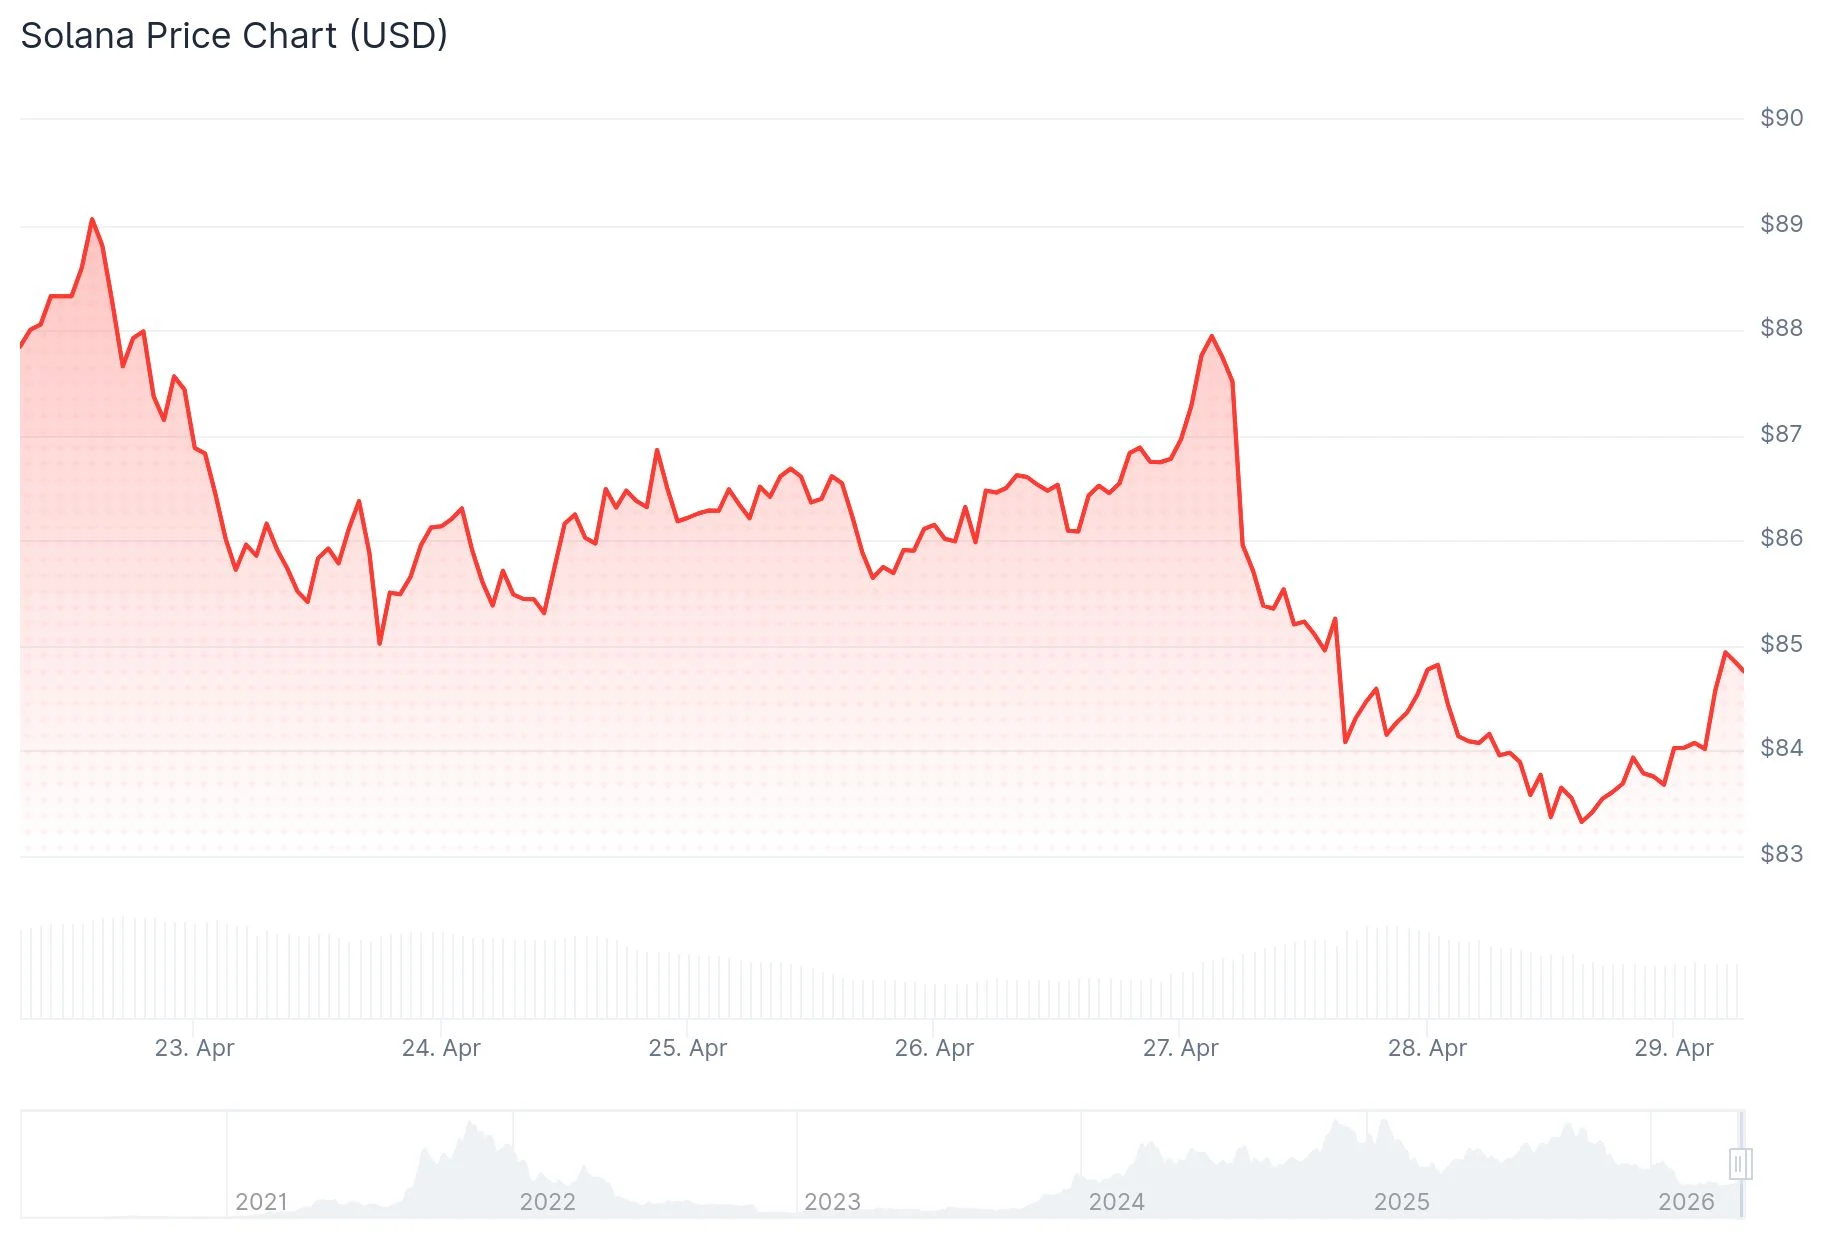
- SOL currently trades between $83 and $85 following a 3%+ decline over 48 hours, positioned beneath all primary exponential moving averages.
- Technical analysts have identified a head and shoulders formation on extended timeframes, with the breached neckline around $110–$120 now serving as resistance.
- The $80 price point represents crucial support territory; a breakdown could trigger moves toward $75 or even $70.
- Futures market metrics reveal modest bullish sentiment, with the long-short ratio reaching 1.08 and funding rates shifting into positive territory.
- Longer-term market observers identify potential accumulation areas spanning $50–$80, while optimistic scenarios project valuations between $500–$1,000 contingent on recapturing the $100 threshold.
Solana faces persistent downward momentum as April 2026 progresses. Trading around $84.58, the digital asset remains trapped beneath its 50-day, 100-day, and 200-day exponential moving averages. These technical benchmarks — positioned at approximately $86.72, $95.36, and $115.06 respectively — have transformed into significant resistance barriers.
The token has surrendered over 3% of its value across the previous two trading sessions. Market sentiment remains uncertain, with purchasing activity demonstrating limited strength at present price levels.
Market analyst Crypto Tony highlighted Solana’s difficulty maintaining positions above the $85–$88 resistance corridor. The formation of consecutive lower peaks on technical charts represents a classic indication of diminishing upward momentum. A recent rebuff near $90 verified that selling pressure persists within that territory.
The $80 threshold constitutes the immediate critical support. Should this level fail, market watchers anticipate a potential descent toward $75, followed by $70.

Bearish Head and Shoulders Formation Emerges
Technical analyst Mister Crypto detected a head and shoulders configuration across higher timeframe charts. This pattern has reached completion, with price action breaching the neckline region spanning $110 to $120.
The compromised neckline now functions as overhead resistance. While a retest of this zone remains plausible, rejection at these levels would likely accelerate downward movement. Bearish price objectives under this scenario encompass $80 initially, with deeper targets extending to $60.
Only a decisive close above $120 would invalidate this negative technical structure and reestablish upward momentum for the cryptocurrency.
Futures Markets Show Optimism Despite Mixed Blockchain Indicators
Notwithstanding lackluster price performance, certain derivatives metrics present a moderately contrarian perspective. According to CoinGlass analytics, Solana’s long-to-short ratio stands at 1.08 — representing the highest reading in more than thirty days. The open interest-weighted funding rate additionally transitioned to positive territory on Tuesday, registering 0.0018%. These figures indicate traders maintain a slight preference for long positions.

Solana’s official X platform announced Tuesday that its Real World Assets infrastructure achieved a fresh all-time peak of $2.5 billion in aggregate value. This achievement demonstrates expanding blockchain utilization, despite concurrent price weakness.
Conversely, Santiment’s social dominance indicator for SOL declined to merely 0.55%. Reduced social engagement typically signals waning retail participation. Exchange-traded fund inflows have similarly stagnated this week, with minimal institutional capital movement documented.
Analyst Crypto Patel adopts a broader perspective, observing SOL has transitioned from downtrend territory into an expansive consolidation phase. The $80 area corresponds with Fibonacci-based support. Additional demand zones exist between $50 and $70, where strategic accumulation might materialize. Patel anticipates a possible liquidity hunt into that range preceding any substantial upward progression. Extended timeframe projections envision SOL reaching $500 or potentially $1,000, though exclusively following a validated recapture of $100.
As of Wednesday’s trading session, SOL remains beneath the 23.6% Fibonacci retracement at $86.67 with the Relative Strength Index positioned near 48 and MACD displaying marginal negativity, indicating measured market conditions rather than capitulation.