
 Stock: Strong Accumulation Signal Emerges Despite 50% Price Drop")
Key Takeaways
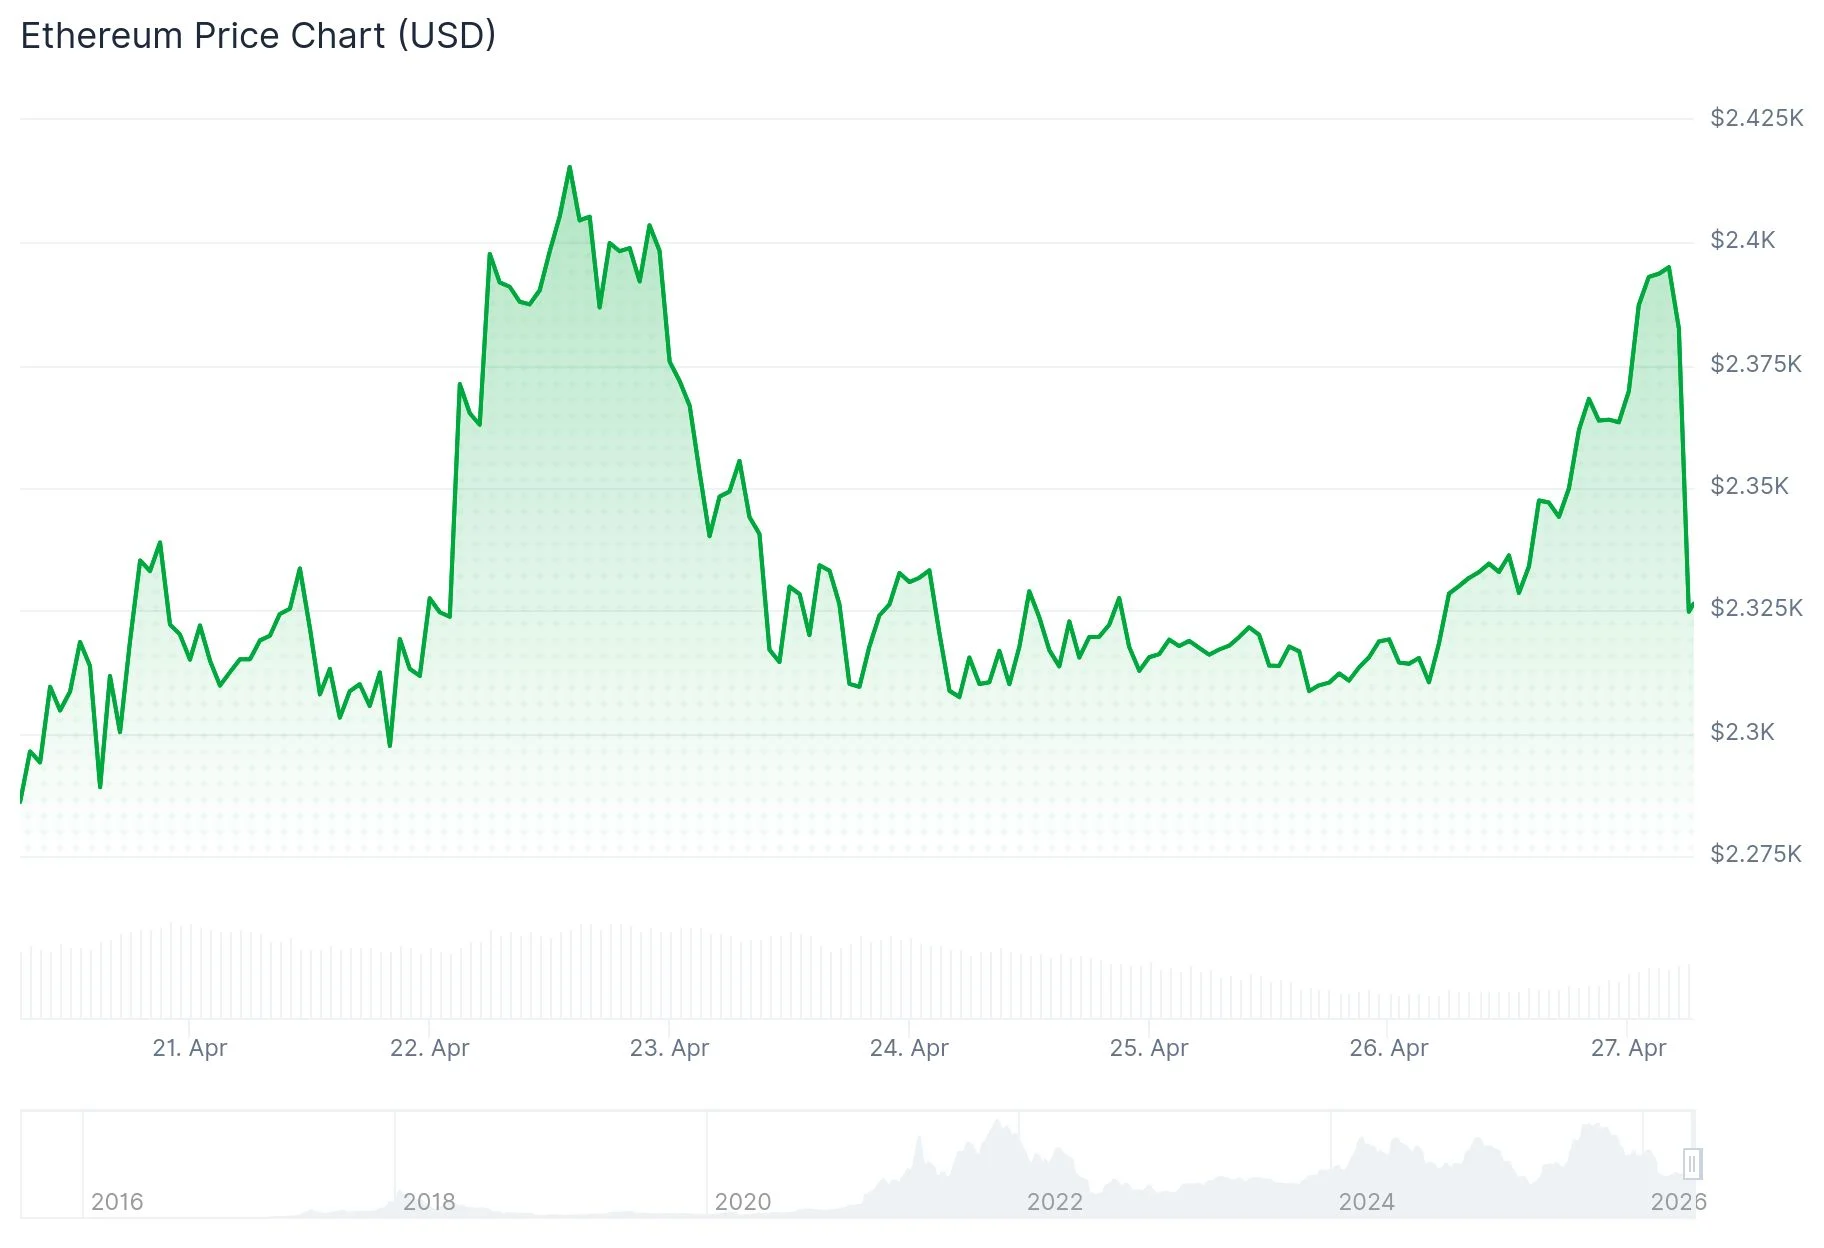
- Ethereum has declined approximately 50% from its October 2025 peak of $4,700 to current levels around $2,300, yet accumulation patterns are emerging
- Taker buy/sell ratio climbed to levels not seen since January 2023, indicating strong aggressive buying pressure
- New smart contract deployments hit an all-time high based on 180-day moving average data
- Spot Ethereum ETFs recorded $155 million in net inflows during the past week, marking three straight weeks of positive flows
- Critical price zones: $2,400 represents overhead resistance while $2,200 offers support if selling intensifies
Ethernet has experienced a significant drawdown of approximately 50% since reaching peak levels near $4,700 in October 2025, currently trading around the $2,300 mark. However, beneath the surface price action, blockchain metrics are revealing that strategic buyers are actively accumulating positions.
According to analytics from CryptoQuant, the 30-day moving average of the taker buy/sell ratio has surged to its most elevated reading since the beginning of 2023. This indicator measures the intensity of market buy orders relative to sell pressure across cryptocurrency exchanges.
The data reveals that buyers continue absorbing available tokens despite the prevailing downtrend. Such accumulation patterns typically signal that sophisticated market participants are establishing positions during periods of weakness.
Network Metrics Show Strength While Price Lags
Additional analysis from CryptoQuant demonstrates that the 180-day moving average tracking fresh smart contract deployments has reached unprecedented levels. This indicates that developer engagement with the Ethereum network continues expanding regardless of token price performance.

Previous cycles have shown that surges in smart contract creation often foreshadow price rebounds. The current disconnect between robust network expansion and depressed valuation suggests the ecosystem’s fundamental health exceeds what current pricing reflects.
Ethereum-focused spot exchange-traded funds attracted $155 million in net capital during the week spanning April 20-24, based on SoSoValue tracking reported by Odaily. This represents the third consecutive week of positive net flows.
BlackRock’s ETHA product dominated inflows with $138 million for the period, pushing its cumulative net inflow to $11.97 billion. BlackRock’s ETHB contributed an additional $60.9 million. Conversely, Grayscale’s ETHE experienced the heaviest outflow at $49.2 million. Combined net assets across all Ethereum spot ETF products currently total $13.79 billion.
Market commentator Ted (@TedPillows) observed that ETH remains range-bound and highlighted that the collapse of US-Iran peace negotiations could introduce heightened volatility in the coming week. He emphasized that breaking above $2,400 might unlock the $2,470-$2,500 liquidity zone, whereas failure to hold $2,300 could lead to a retest of the $2,150-$2,200 area.
Technical Picture and Critical Price Zones
Examining the hourly timeframe, Ethereum successfully breached an ascending triangle pattern with resistance positioned at $2,320. Following this breakout, price climbed to $2,404 before entering a consolidation phase. Currently, ETH trades above $2,370 and maintains position above its 100-hour simple moving average.
Near-term resistance appears at $2,400, followed by $2,420 and $2,450. Successfully clearing $2,450 could establish momentum toward $2,500 with extended targets at $2,550-$2,565.
Regarding downside protection, $2,330 represents the initial support level. Should that fail, attention shifts to $2,285 and the more substantial $2,200 zone.
Bitmine Immersion Technologies, linked to market analyst Tom Lee, revealed plans to purchase 10,000 ETH directly from the Ethereum Foundation through an over-the-counter transaction valued at $23.9 million, which would expand its holdings to 4.98 million ETH.