
 Stock: $1B in ETF Inflows Fuel Rally as RWA Assets Surge to $2B")
Key Highlights
- Solana is currently trading at $85.95, maintaining position above its 20-day EMA support at $85.31, while facing resistance at the 50-day EMA of $87.08 throughout March.
- A significant technical development shows SOL breaking through a prolonged descending trendline on daily timeframes, currently retesting this level for confirmation.
- Weekly timeframe analysis identifies $120–$125 as the primary upside objective if the token successfully clears its near-term downtrend resistance.
- The network’s real-world asset tokenization exploded from $170M to $2B over twelve months, supported by 80–100M active wallets and $17B in stablecoin liquidity.
- Cumulative spot ETF inflows have exceeded $1B for the first time, while total net assets stand at $887.92M.
As of April 23, Solana is changing hands at $85.95, reflecting a 1.10% decline over 24 hours. The token continues to find support just above its 20-day exponential moving average positioned at $85.31, which has provided a floor for price action over recent sessions.
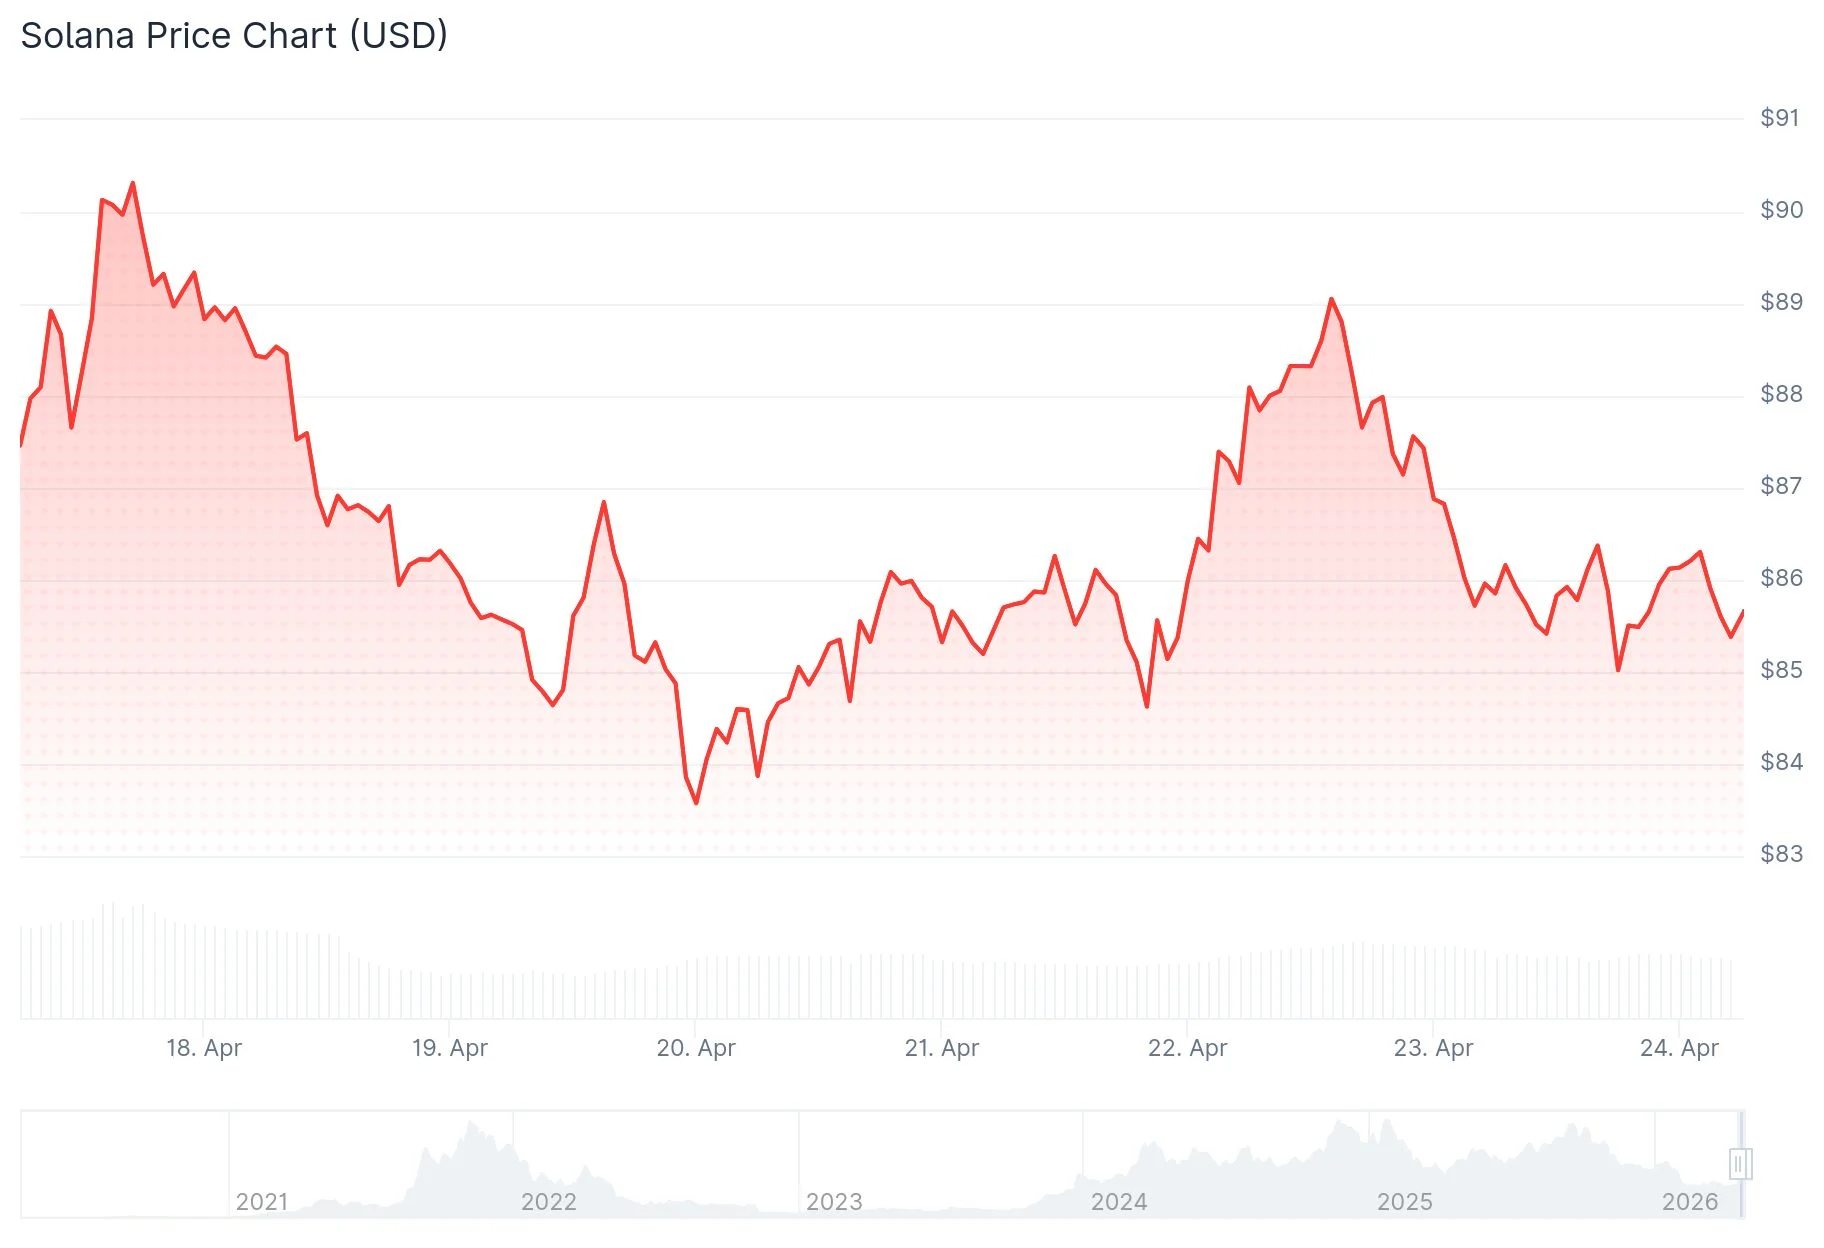
The critical overhead barrier remains the 50-day EMA at $87.08. Since March began, each daily session has failed to close convincingly above this technical threshold. The upper boundary of the Bollinger Band indicator registers at $89.43, while the 100-day EMA extends further to $96.63.
Regarding downside risk, a confirmed daily close beneath the 20-day EMA would expose the middle Bollinger Band at $84.63. Further weakness could target the lower Bollinger Band stationed at $79.84, with the February bottom located around $67.
Examining the daily timeframe reveals that SOL has successfully cleared a descending resistance line that constrained upward movement throughout late 2025 and into early 2026. Technical commentary from CryptoCurb on X highlights this breakout occurring after multiple rejection attempts, including during periods of market stress like the Binance flash crash and geopolitical tensions involving Iran.

[[LINK_START_0]]https://twitter.com/CryptoCurb/status/2046978584418611353?s=20[[LINK_END_0]]
Price action is currently consolidating near this breakout region instead of reversing below it. This represents a meaningful shift in market structure. However, confirmation requires buyers to defend this zone and establish the former resistance trendline as new support.
Institutional Capital Accelerates
According to Solana ecosystem executive Nick Ducoff, real-world asset tokenization on the blockchain expanded from $170M to $2B within a single year — representing approximately 12x growth. Institutional participants have highlighted three primary attractions: proven network stability, a distribution network of 80 to 100 million active wallets, and $17B in stablecoin infrastructure already deployed on-chain.
[[LINK_START_1]]https://twitter.com/solana/status/2046908400056082596?s=20[[LINK_END_1]]
Spot ETF products tracking SOL have now accumulated over $1B in cumulative inflows, marking a significant milestone. Current total net assets measure $887.92M, equivalent to 1.77% of Solana’s overall market capitalization. The previous week saw $35.17M in net inflows. While April 22 registered no new inflows, the three preceding trading days collectively contributed $31.32M.
Weekly Timeframe Suggests $120–$125 Upside
Analyzing the weekly chart, research from Rendoshi AI on X illustrates SOL testing a falling trendline after successfully defending support in the $75–$80 region. The Relative Strength Index has rebounded from near oversold territory, indicating strengthening momentum, though this alone doesn’t validate a confirmed breakout.
Should SOL decisively break and maintain position above the weekly downtrend line, the subsequent major resistance zone emerges at $120 to $125. Failure to sustain this breakout would likely trap SOL in a range-bound pattern above $75–$80 support without establishing a clear recovery trajectory.
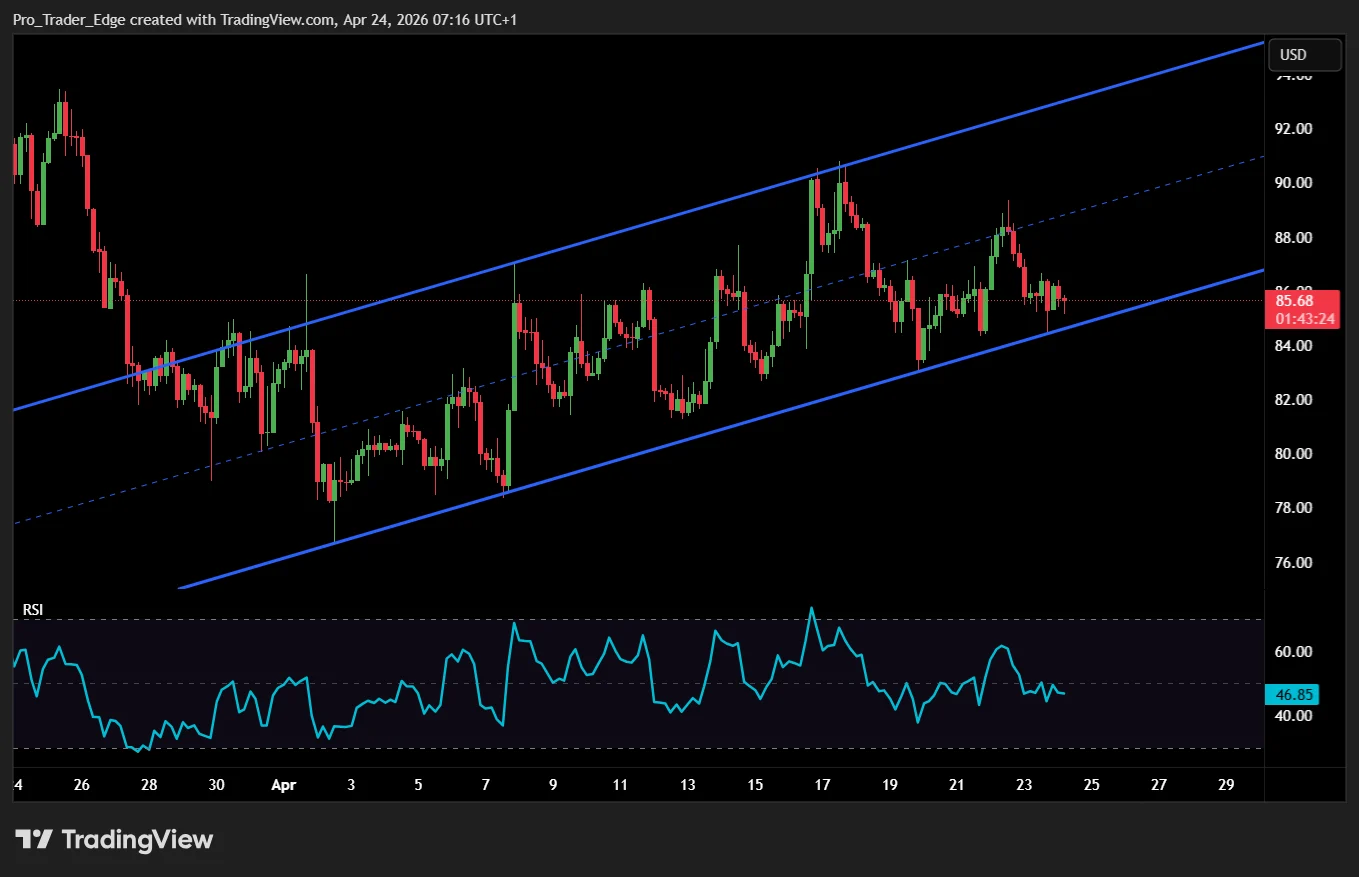
On the 2-hour timeframe, Solana is navigating within an ascending channel pattern that originated from the April 2 low near $78. The RSI indicator generated a fresh bullish signal at the recent dip toward $83 — mirroring the setup that preceded previous rebounds. The MACD histogram remains in negative territory at -0.25, indicating momentum confirmation is still pending.
The lower boundary of the 2-hour ascending channel at $83–$84 coincides with the daily 20-day EMA, establishing this zone as the critical support level to monitor heading into April 24.