
 Stock Shows Recovery Signs After 68% Decline From Peak")
Quick Overview
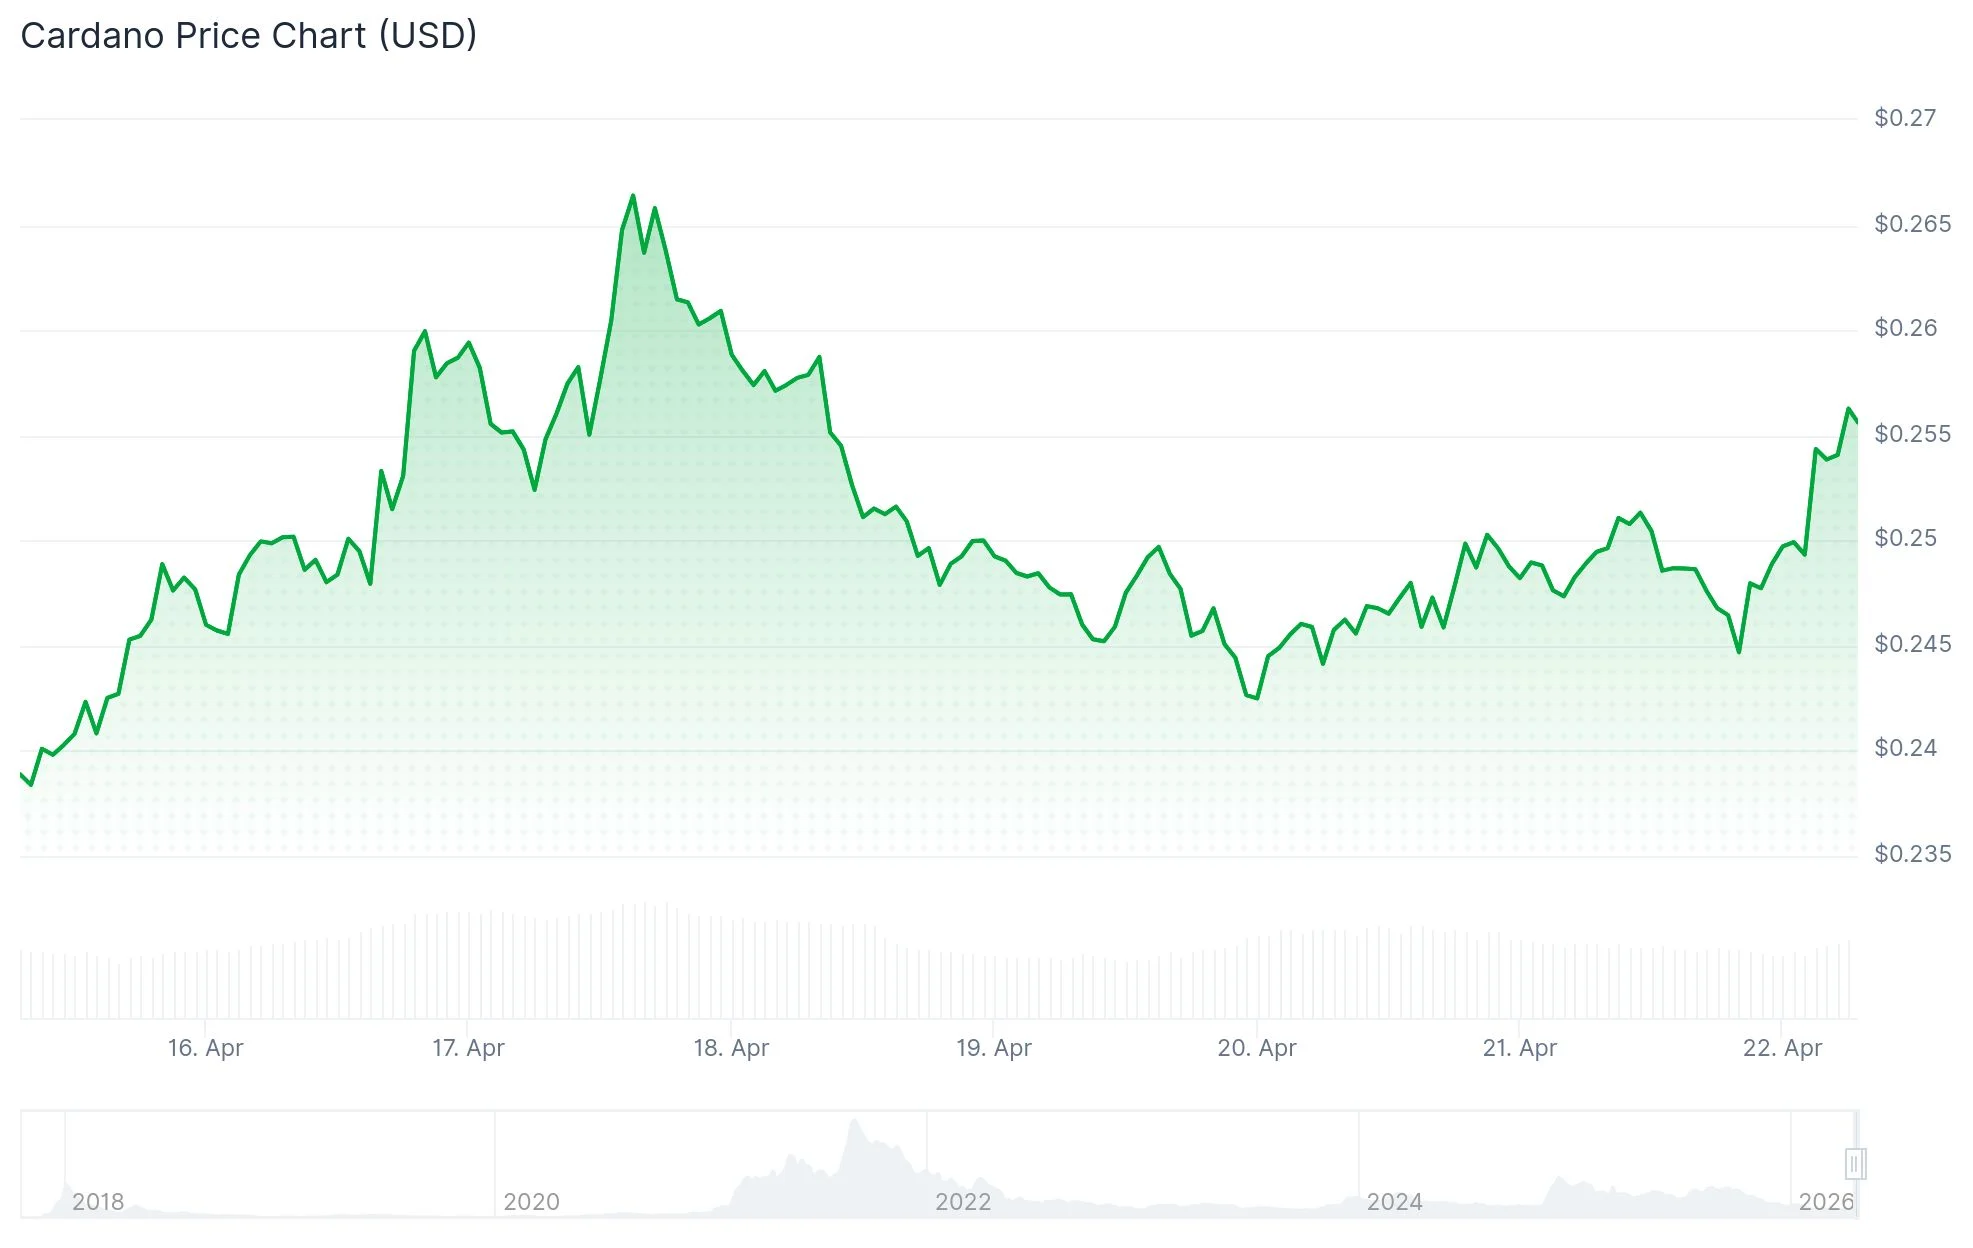
- Cardano is currently changing hands near $0.25 with modest gains recorded on April 21
- Trading volume for CME futures contracts exploded 155% over a 48-hour period, climbing from 27 to 69 contracts
- Open Interest in ADA futures climbed more than 5% within a single day, reaching $459.02 million
- Technical chart analysis reveals a falling wedge formation that projects a potential rally to $0.30
- Current long/short positioning at 0.73 creates conditions favorable for a short squeeze scenario
Cardano (ADA) has experienced significant downward pressure starting in mid-January, with the digital asset plummeting 68% from its $0.42 peak on January 14 to its current level near $0.25. Despite this prolonged decline, emerging signals suggest the cryptocurrency may be preparing for a potential reversal as market dynamics evolve.
The cryptocurrency sector as a whole has witnessed the fear and greed indicator climb from an extreme low of 12 to 33 throughout the previous week. Although market sentiment remains anchored in “fear” territory, this upward movement indicates that panic selling may be subsiding.
According to CoinGlass data, Open Interest for ADA futures contracts surged by over 5% during a 24-hour timeframe, climbing to $459.02 million. The positive funding rate standing at 0.0090% demonstrates that long position holders are prepared to pay a premium, indicating bullish conviction among leveraged traders.

Information from CME Group reveals that ADA futures contract volume skyrocketed from just 27 contracts on April 15 to 69 contracts by April 17. This dramatic 155% increase over merely two trading sessions signals heightened participation from institutional market participants.

The present long/short ratio registers at 0.73, indicating that short sellers outnumber long position holders. This imbalance creates a scenario where a rapid upward price movement could initiate cascading liquidations, forcing short traders to buy back their positions and potentially accelerating the rally.
Additionally, the funding rate has occasionally dipped into negative territory, which means short position holders are actually paying fees to maintain their bearish bets. Such conditions typically set the stage for a short squeeze event if upward price momentum gains traction quickly enough.
Chart Analysis
From a technical standpoint, ADA has successfully broken above a falling wedge pattern. However, the cryptocurrency requires multiple consecutive closing prices above the upper boundary of this formation to validate a complete bullish trend reversal.
Measuring the height of the wedge pattern and projecting it upward from the breakout point indicates a potential advance from the current $0.25 level to $0.30, representing approximately 23% upside. Technical strategists emphasize that the intermediate resistance at $0.28 must be decisively cleared before the $0.30 objective becomes achievable.
The 50-day Exponential Moving Average positioned at $0.26 currently represents the first significant resistance barrier. Further overhead resistance lies at the 100-day EMA located at $0.3009, while the 200-day EMA stands at $0.3953, both presenting substantial challenges for any sustained rally.
The Relative Strength Index currently registers around 51, indicating that price momentum is finding equilibrium but hasn’t yet developed compelling strength. Market participants appear cautious and are maintaining a wait-and-see approach at these resistance zones.
The MACD histogram shows a marginal position above its signal line, producing a slightly positive reading. This configuration suggests the possibility of a bullish trend emergence, though it hasn’t yet confirmed a decisive directional move.
Critical Support Zones Under Focus
Should downward pressure resume, ADA maintains crucial support at the $0.2328 level, which corresponds to the March 29 bottom. A breach of that floor would likely send the cryptocurrency toward $0.2205, marking the February 6 low and representing the subsequent defensive level.
As of April 21, ADA was exchanging hands at roughly $0.2554, successfully maintaining its position above the psychologically important $0.25 threshold for three straight days. The 50-day EMA at $0.26 continues to serve as the most pressing obstacle for any sustained upward movement.